Hi, I have a java app that’s been running on a shared-1x-cpu@256MB for a while now. About 2 weeks ago I deployed a new version and noticed that responsiveness down significantly, but eventually repaired itself. Did another deploy today and noticed the same thing, but decided to look at grafana metrics.
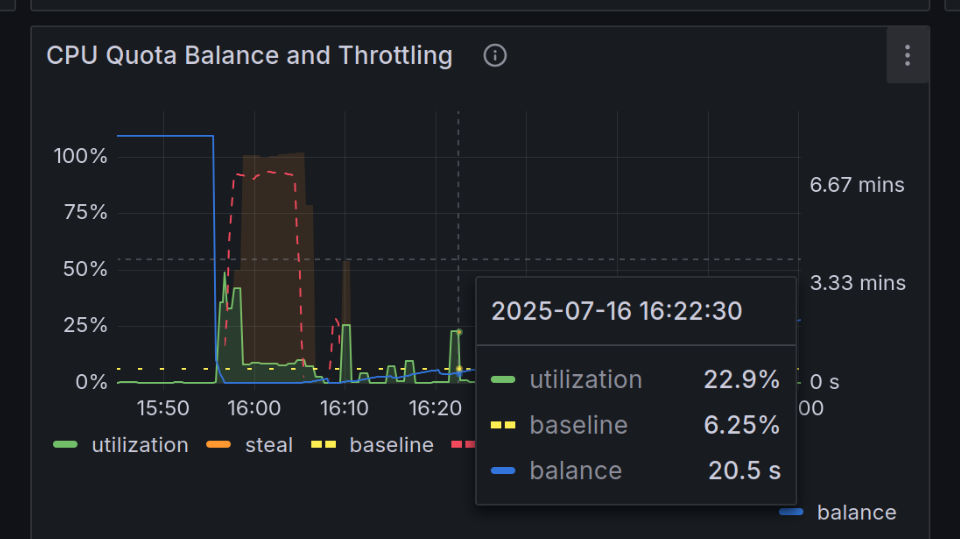
What I see is that the “balance” blue line goes rapidly from 8.33 minutes to ~0 within 1 minute of the deploy, and then load average, steal and throttle start to go up. Once the balance recovers, the app is usable again but unclear what to do about deploys resetting the burst? I did see the announcements/documentation about the cpu throttling changes, but they don’t seem to address this?
Thanks!
Would you share the graphs you’re looking at? It may help to look at top or similar inside your app. What kind of load (say req/sec) is your app under? Or does your app produce a higher load during deploy?
req/sec is practically negligible, there’s been less than 200 requests since the deploy yesterday. there may be higher load on startup in terms of JVM jit-ing, dependency injection/reflection stuff, but not sure how it would burn through 8 minutes of balance in less than a minute with actual cpu utilization less than 50% according to same grafana chart.
I’d first redeploy temporarily with a better CPU to understand what’s happening here, especially if the graph you show can always be replicated on deploy. I did also think about that CPU throttling post myself too.
Secondly, I wonder if there are options you can supply in Java to slow down the initial CPU usage. I think you can also use the JVM to record what is happening in that ten-minute window (either on your current machine type, or the temporarily improved one). I don’t use Java, but as a random guess, could the garbage collector be doing unnecessary stuff?
It might be worth experimenting with a different JVM, in case there is a more efficient one available.
Finally, it may be worth looking at your app, or its dependencies, to see if it is doing anything at the start of its lifecycle that is doing work you don’t know about.
Sure, but isn’t the real problem that something is consuming CPU at deploy, and if that can be tackled, the non-ideal CPU throttling would be academic?
Thanks for the pointer @mayailurus – I saw the threads but not the part where it talked about “machine versions” (or I just didn’t equate “new deploy” with “machine version”). Either way the behavior is at least explained if not ideal. I mean I guess I can completely rewrite my app in rust instead of jvm…
@btoews is there any plan for the “hopefully change in the future” part of the comment? can CPU Performance · Fly Docs be updated to talk about deployments/versions? it currently just talks about applications and machines…
If your initial CPU throttling comes from warming up the compilation cache, maybe in the short term you can detune it so it does less work here? If you’re on 3 or 4, maybe you can drop it down one or two levels?