Single machine performance and reliability

So my company has written an app that uses Node (Hono) and SQLite. It’s a completely headless API and it could hardly be more simple for a production app: It’s an API proxy that does some data masking, audit logging, stores API tokens, etc. Uses Arcjet for WAF, Tigris for storage and Litestream backup. It’s not critical to have 100% uptime, so I’m using SQLite with Litestream and limiting it to run on a single machine. It auto-restores the backup from the Litestream bucket if the node is started with empty storage as a sort of poor-man’s high-availability, although it’s certainly not true HA. However, I’ve been running it for a few weeks with zero load other than the health checks and the uptime is.. worse than I expected.. One case was 44 minutes down.

I’m using BetterStack to monitor with a 3-minute interval. I just started using BetterStack so it’s new to me, but I also have three other monitors as a control on different sites and those have not experienced any false downtime reports so I don’t think that is a factor.

One of the downtimes was 44 minutes long, during which I was manually testing and it was definitely down and only a very small percentage of requests were successful and when they were successful they were also very slow. I can’t remember, I think I may have finally restarted the machine to bring it back up..

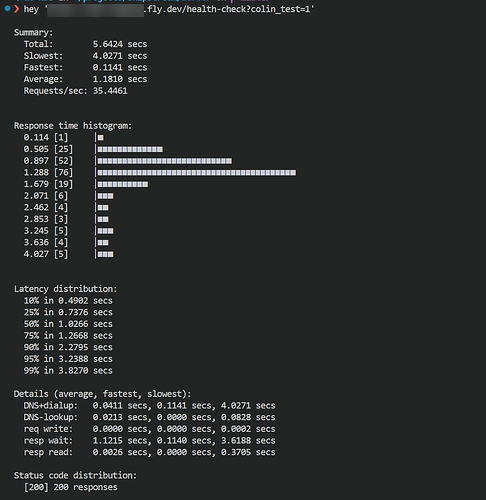
The health check normally responds in ~150ms when not running a large number of concurrent requests. When running 50 concurrent requests it doesn’t have any errors but the response rates can be pretty high.

Is this typical for a single machine on Fly? I was expecting it to be more on par with something like a Linode or Digital Ocean virtual machine, which is sufficient for my use-case based on my experience. But 99.8277% over the last 30 days is disappointing.

Thanks!


1 Like

Anecdotally, I would guess the median opinion of this forum is that Fly has a little way to go on host and connectivity reliability. However, I think it will vary between regions; my little app in London has been pretty solid. Where is your app located?

This app is in Ashburn, VA (iad).

Is it perhaps the shared CPU (I’m using shared-cpu-2x@512MB)? Would the performance CPUs have better reliability? They are just way more costly..

I’d not say so. The reliability issues that have been reported here are generally NVMe corruption and connectivity/API problems, and I’d not imagine that a better CPU would affect either of those things. Incidentally, the kinds of incident the team deals with are logged pretty openly; the incidents blog makes for interesting reading.

Hi there,

Node is more resource-intensive than it looks; a tiny 256MB Fly machine with Node is likely to struggle with 50 concurrent requests. This is telling: “When running 50 concurrent requests it doesn’t have any errors but the response rates can be pretty high.” ← just this suggests the machine is on its knees with that volume of requests and it starts bogging down.

You’re not explicitly setting hard_limit, so basically the Fly proxy will send all connections to the machine as they come in, and as mentioned, it can entirely overwhelm it.

What I’d recommend is setting a lower hard_limit (perhaps 10 or 20) and tune it up until you see the machine starting to struggle with response times, and then bring it back down a bit. You want the hard_limit to be a value the machine is comfortable handling; never set it to a value that the machine has trouble or slowness with. Once it’s set, there are two ways to handle more concurrent requests:

  1. Add more machines (easiest)
  2. Scale up the machine (it sounds easier but then you have to re-tune the hard limit).

A lower hard limit means an onslaught of requests is managed at the Proxy layer, not at the app/machine level; the proxy will “dosify” the requests at a volume the machine is comfortable handling. If there are too many requests, they queue at the proxy and they may eventually 503 at the proxy but the machine itself should never be brought down by the volume.

(picture a gatekeeper controlling how people enter a store a few at a time, so the cashier inside can serve one or two people at a time, vs. opening the gates widely and letting a mob stampede the poor cashier into a goopy mush).

We have a limit-tuning guide here.

If that doesn’t help, it would be helpful to know what those “44 minutes down” looked like - what did you get? errors? timeouts? when it happens, can you check fly logs and metrics (Sign in to Your Account · Fly, go to your Apps page, and check the metrics page - there’s a Grafana icon at the top right which will give you more details than the first-page metrics). This will also help understand if your app is struggling resource-wise.

Cheers!

  • Daniel

Thanks for the info, Daniel, it’s very helpful. I did have limits set, but apparently too high:

  [http_service.concurrency]
    type = 'requests'
    hard_limit = 500
    soft_limit = 400

Limiting the request rate via “hey -c” down to 20, 10 and 5 req/s does yield a much better histogram without the slow outliers, with 15 being the sweet spot as far as maxing the req/s with minimal slow requests.

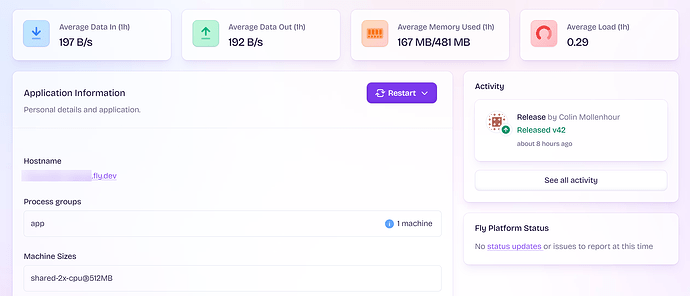
Regarding memory, though, my machine size is and has been ‘shared-cpu-2x@512MB’ and as you can see in the screenshot, it’s using 167MB at idle. I’m testing against the health-check route which doesn’t do much, just a “SELECT 1” on SQLite and fetching a single key on Tigris. I’ve setup a separate monitor now that doesn’t do the Tigris check and also disabled Tigris for load testing to eliminate that as a possible factor. So now overall the app is doing hardly more than “Hello world”. Removing the Tigris check gets the Fly app from ~35-45req/s with Tigris to ~55-60req/s at 15 to 200 concurrency. I’m sure network bandwidth could play a small part, but I’m testing with a 1Gbps uplink and the request/response are just a little over 100 bytes so I think it is negligible as far as impacting req/s.

Running on my PC, I get ~1864req/s at 50 concurrency and ~5684req/s at 500 concurrency with no memory limit. At 500 concurrency with 50,000 requests, monitoring with docker stats, it climbed to 240MB of RAM before the test ended. I used “docker run -m 512M” to emulate the 512MB limit of the Fly machine and I still got ~4663req/s with zero failures. I dropped it to just 128M and I still got ~4411 with zero failures. The Fly machine is running Litestream which in my tests seems to consume only about 16M of RAM at idle (my tests are read-only so don’t write to the WAL). I think this pretty conclusively proves that while it does perform slightly better with more memory, the app is not severely memory starved at a 512MB VM size.

Next, I used the ‘–cpus’ option of Docker to limit CPU, keeping memory limit at 256M to be fair. My PC’s CPU is an Intel i7-12700KF. At 0.5 CPUs I got 1865 req/s with a 0.16% failure rate (84 of 50,000 - still 500 concurrency). In order to get in the 50-60 requests per second ballpark on my PC I had to use “–cpus 0.03”! That’s pretty shocking..

I hate to be negative on your forums, but I was not expecting a ‘shared-cpu-2x@512MB’ CPU to perform on par with “–cpus 0.03” on my local PC. The ‘performance’ class CPUs may be 10x faster, but it brings you into a completely different pricing tier that is in the realm of low-end dedicated servers.

Again, I’ll be the first to admit that running a single machine is not what Fly is engineered to be best at. In my case, I was hoping to run some microservices that used a SQLite database with Litestream continuous backup to avoid the complexities of horizontal scaling and database replication or building logic into my app for fly-replay. Fly can certainly still do that, and I love the simplicity and the CLI and the ecosystem, but the CPU performance is definitely causing me some concern. Given the single-node design, I can’t auto-scale this app and have to scale it vertically, so unless I scale to zero often, the cost of running a machine large enough to handle the peak load all of the time is a lot higher than anticipated.

As far as what the outages looked like, they were pretty much all 503 errors with 15-16 second response times. My app does not return 503 responses for the health check endpoint under any circumstance. Here is an example response header for a failed request:

HTTP/2 503
server: Fly/a608e03f9 (2025-07-10)
via: 2 fly.io
fly-request-id: 01JZXFNEGKYAG4SYVVQ8V4KTVF-dfw
date: Fri, 11 Jul 2025 19:34:00 GMT

Response timing:

Redirect count           0
Name lookup time         2.5e-05
Connect time             0.001253
Pre-transfer time        0.047721
Start-transfer time      15.461976
App connect time         0.047481
Redirect time            0.0
Total time               15.656464
Response code            503
Return keyword           ok

Note, this is a “staging” app so it receives zero traffic other than the health checks every 3 minutes (unless it’s getting hit by a bot which could be the case - I’ll try to confirm that next time via the logs).

Thanks for your help!

This topic was automatically closed 7 days after the last reply. New replies are no longer allowed.