I noticed in the metrics sections of the app, there is an HTTP Cache Ratio. I was curious what cache this was referring to and how to use it correctly.
I have an in-memory cache and Redis cache. I was curious if Fly had a cache itself?
Is there a header that needs set for this to report correctly?
The current query is -
sum(rate(fly_app_http_responses_count{app="showdown-labs",cache=~"^.+$"}[15s])) by (cache) /
      ignoring (cache) group_left sum(rate(fly_app_http_responses_count{app="showdown-labs",cache=~"^.+$"}[15s]))
Yeah, it could just be that parts were built out one after another.
Meaning, first setup the metrics back-end part of it, then allow this new feature to plug into metrics, so this new info can also be pulled.
That thread does mention this:
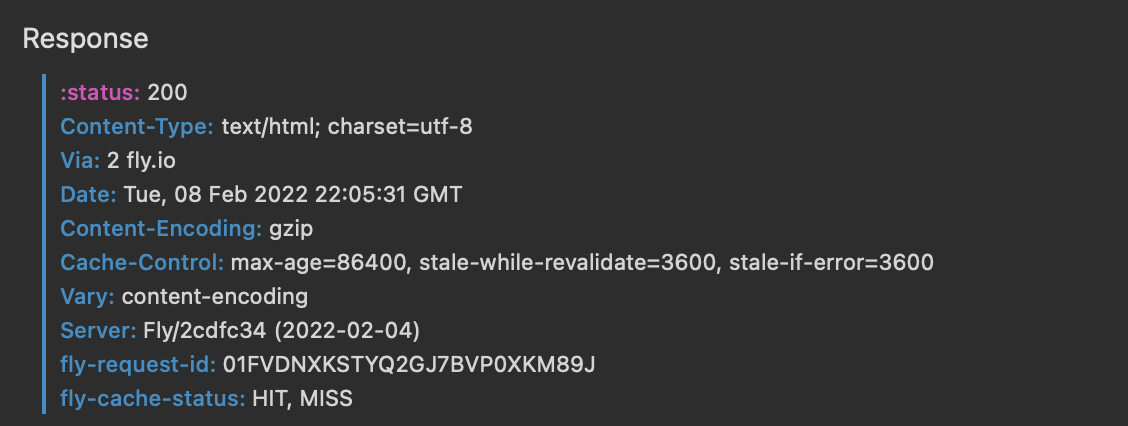
There’s a fly-cache-status: HIT (or MISS) in the responses.
Yeah, but that is fly inserting that based on [[statics]]. I was curious if there is a userland header I can return in my app that allows it to be picked up in metrics. Normally the fly-* is for fly purposes only.
Ok, awesome. I was tempted to not add this because of the fly-* start. I didn’t want to cause issues downstream. But will add this and see how it works.
It is registering the “HIT”. Because I visited the wrong page first (without headers set), I don’t know if it’s recording both “HIT” and “MISS”. Will try again later and try and validate.
I’m 99% sure we don’t add to the fly-cache-status header. That graph doesn’t parse the status, it just shows exactly what we got. So HIT means our proxy saw just the header HIT, for example.
I have an alternate block of code when I find an entry in Redis that will return “HIT” or “STALE”, depending on if it plans to rebuild the file after writing the output of the cached version.
That being said, locally, I don’t show the extra , MISS when running. It only shows the HIT or MISS once.
We just dug through the code and we never set fly-cache-status on proxied requests. We read it on the way through and update metrics, but there’s no code to set it!
Are you proxying that request yourself somehow? That looks a lot like what would happen with a proxy, for sure. It’s very confusing.