Hi we have an app deployed with managed Postgres and Redis on up stash but we have problem that is fixed by periodically restarting the machines.
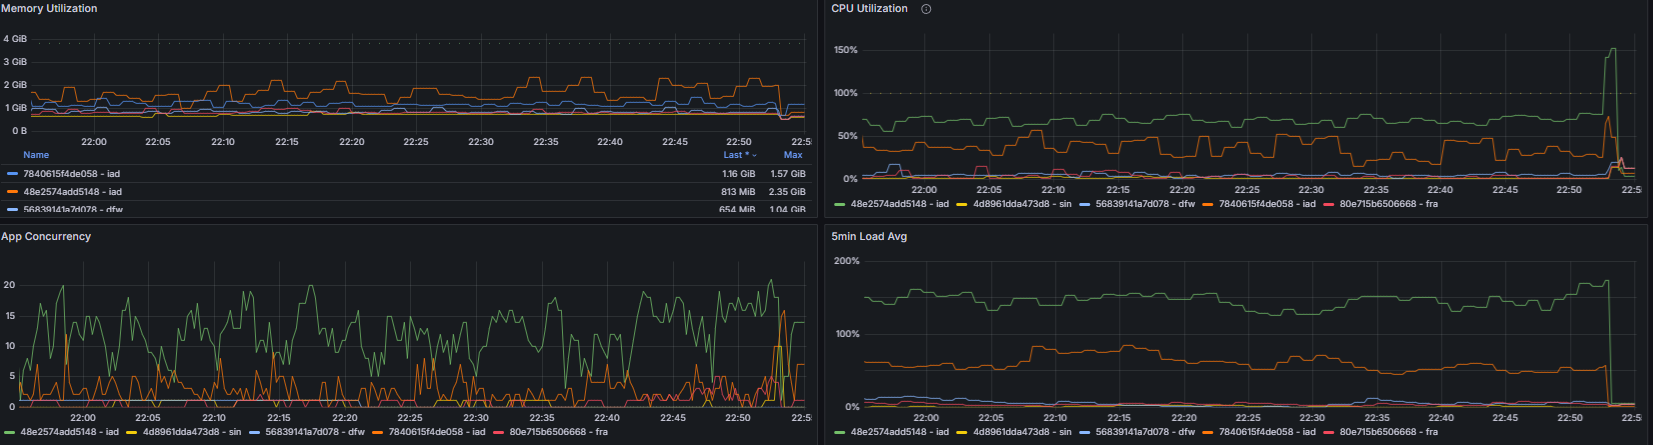
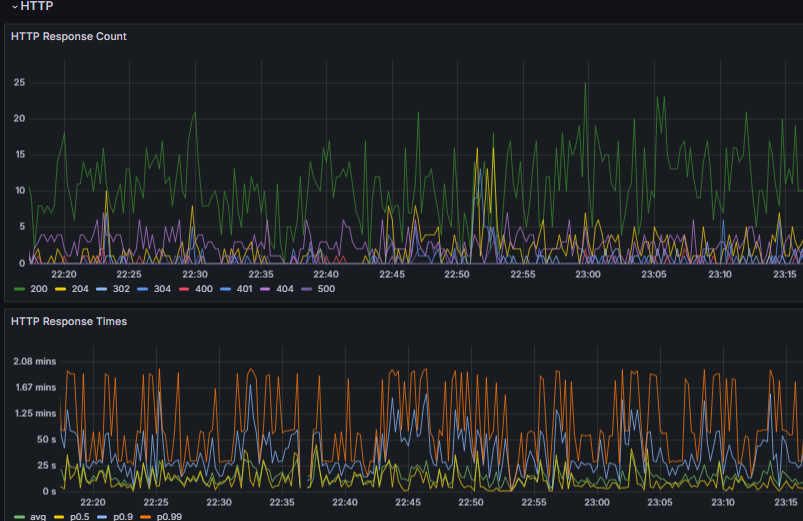
Server after a couple of hours becomes unresponsive, throwing 500. We thought maybe redis is getting hanged so we implement Pinging to it to be sure that connections are alive but this did not change anything. Our app stats are looking like this. The spikes are when we restarted the servers. Are they normal or should we bump IAD to be bigger. Currently IAD is on 2x 2xPerformance 4GB
That green CPU line is showing rather a lot of load. Assuming this is your web/application server (and not the database) I’d suggest addressing this. What RAM and CPU class are you using for this app? Would you describe the stack a bit e.g. framework, language, req/sec, etc?
yup thats a application next.js front with nest.js backend so basically node app. For all regions we are using performance-cpu-2x@4096MB we have 2 IAD regions.
I’d suggest bumping up to performance-cpu-4x for a week, or scale out to more machines. If that fixes it, your app is CPU-bound for your current traffic levels. From there, you could either lean into more infra spend, or make your app more efficient per request.