Predictable Processor Performance

evening guys, i received email this afternoon. there are a lot of questions in my brain, i hope someone here can help me clarify these. Thanks in advance.

I have 2 apps 3 machines:

  • App A (2 machines)
  • App B (1 machine)

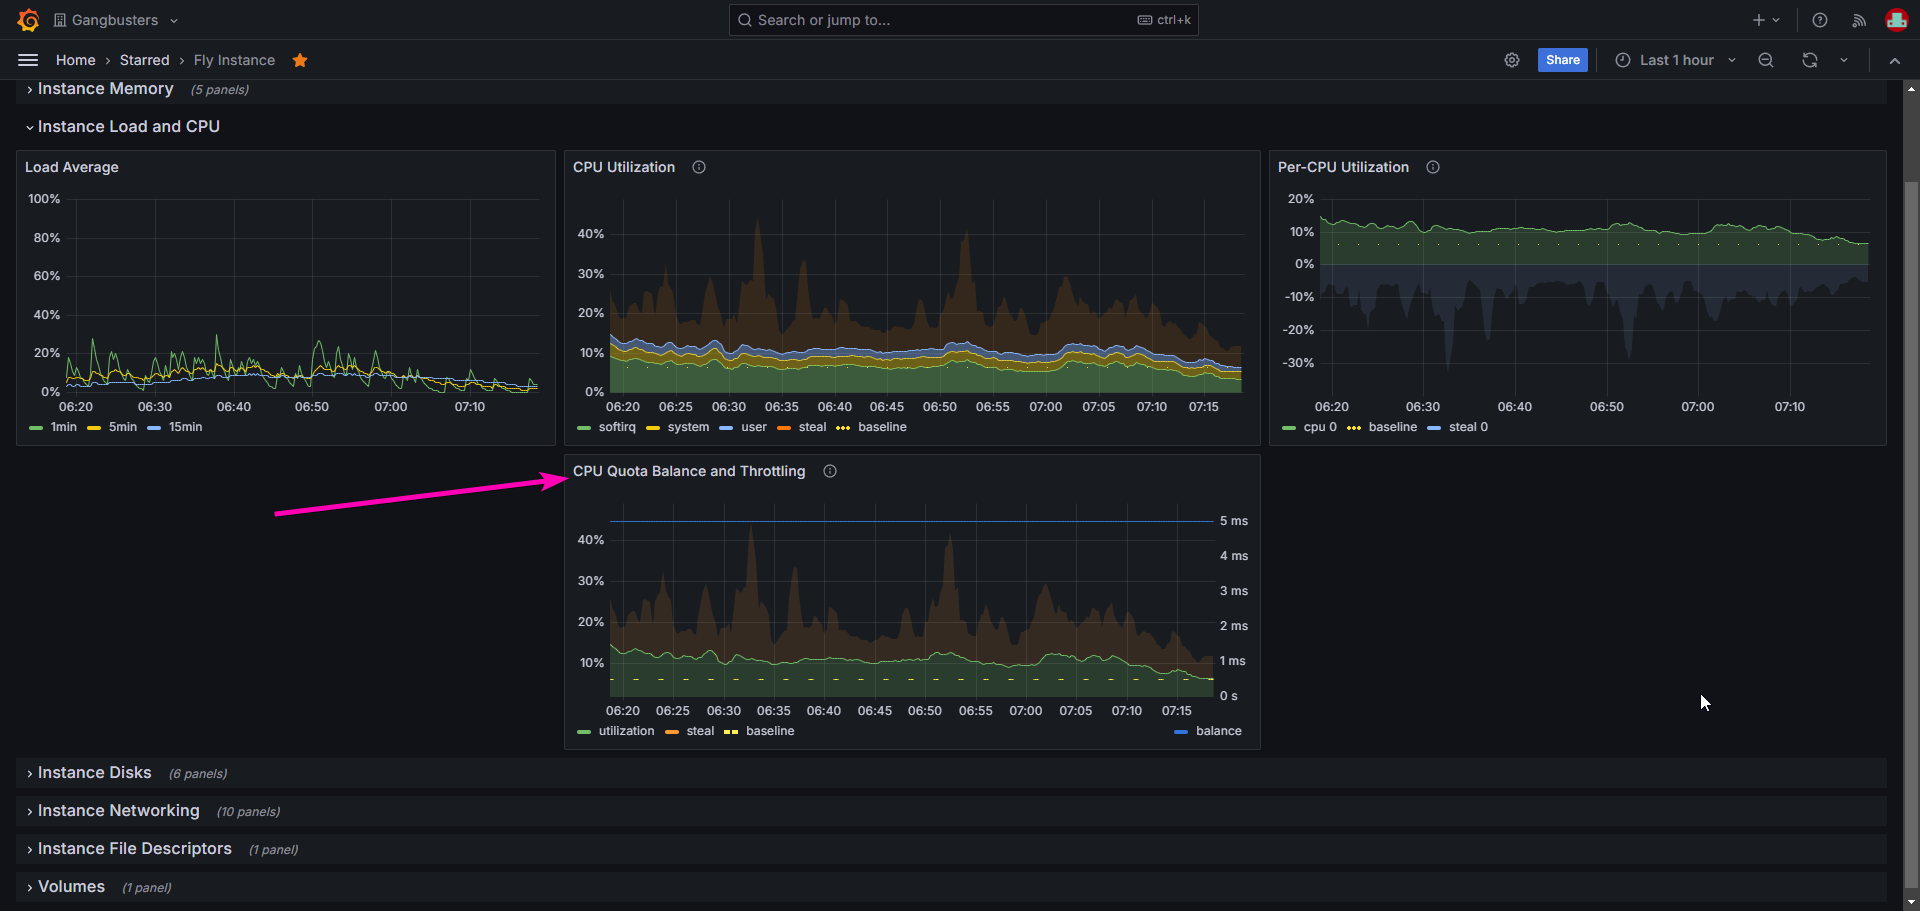
below image is App A (2 machines)


looking at image above,

  1. i assume it is under utilised, i mean giving it too much CPU power. right? does that means, i don’t have to worry about being throttled?
  2. or it means otherwise? looking at the quota balance, the utilisation only has that much left.

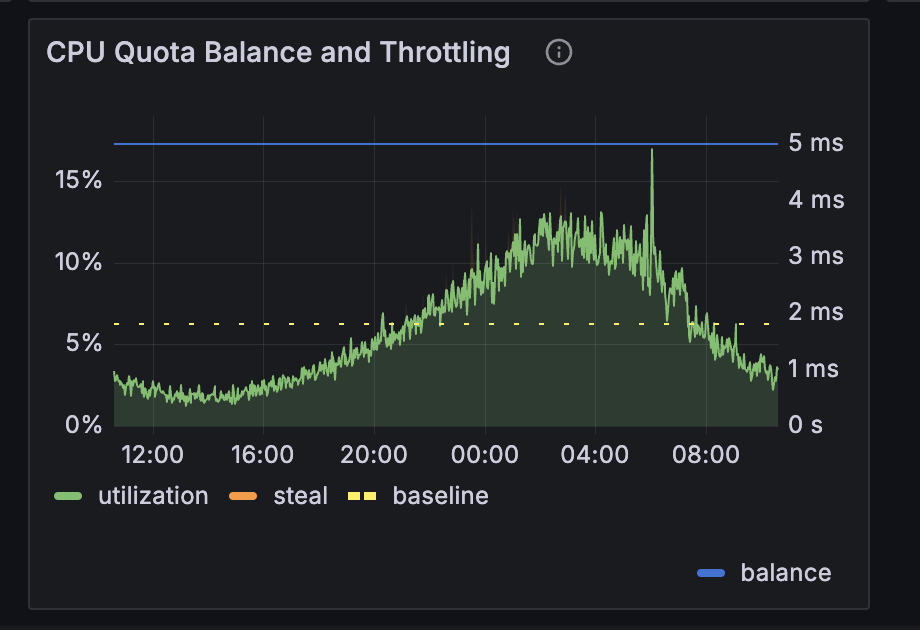
Below image is App B (1 machine), this is the machine i received warning email.

  1. from the cpu utilisation, i can see high utilization, it is around 20%.
  2. The CPU quota is confusing to me, looking at the chart, the balance is at 5ms there, does that means the quota is used up or still 100% available?
  3. or, the sharp drop means throttled?

am sorry for those dummy questions, i am quite beginner in flyio machine things and i didn’t catch up well, flyio innovate and moves fast.

and 1 last question,

  1. The “throttled” means the machine will be down and paused for the throttled duration or it slows down to certain level? am confused.

thanks in advance guys.

1 Like

I’d not say Fly never communicated, but most certainly, they should have over communicated.

From August 2021 (3+ years ago):

2 Likes

Thanks for replying. It would be helpful to add a link to the graph (if it exists) of how much resource is taken by a given machine in your intro post (and not is some reply below). Is that the CPU utilization in grafana or is it somewhere else? (I don’t see one called CPU quota balance like other graphs you’ve shown).

Thanks.

It’s part of the Grafana dashboards that fly provides, under the Fly Instance dashboard.

1 Like

My understanding is that it is tracked per instance instead of per core (especially as the balance metric doesn’t have any CPU identifiers in the attributes), so yes theoretically you could use shared-8x with a single core app and sustain a load of 50%.

2 Likes

That’s correct. This machine isn’t using much CPU and has accrued a big balanced. This means that the machine can burst (use high CPU) for however many minutes the balance says (looks like ~7 minutes).

Yep.

That means that this machine cannot burst (the 5ms value is a bit confusing). If quotas were currently enforced, this machine would be limited to running at it’s baseline (6.25% CPU).

These are great questions. We posted this thread so we could help folks through this change.

In the case of your machine that’s using a lot of CPU, it means that the vCPU will be able to run for 5ms out of every 80ms (6.25% of the time). Depending on the app, it might be totally fine for it to be throttled like this. It might mean requests (assuming it’s a web app) take a bit longer to process.

That’s correct

1 Like

Hi,

I have a couple of questions. :smiley:

1. Why did this app get notification of underprovisioning?

Message said: “.. shared-1x - throttled for 24.0h”. I do not understand how this application is underprovisioned. Is it the Load Average spikes?

What you see is the utilization of a pg db app before and after I upgraded to shared-cpu-2x (after getting the “Underprovisioned machines” email). When looking at the before-part, (most) graphs show utilization below the marked baseline. The load average shows spikes up towards 50-60% so I guess that might be the cause of the report about underprovisioning? But the graphs does not look like the other cases above where you could see the CPU utilization graphs spike as well. Is this because the spikes are so quick that they only register on the load average and not on the other graphs? This confuses me. :thinking:

2. How should I handle an app with a heavy sync job

I have an app in another org that I have not gotten any notification about (yet) with this CPU usage pattern:

It just goes full bore for about 20 minutes. I guess the planned enforcement would cause issues for this app. I’m not fully grasping what the consequences would be in this case. Would my best option be to use FLAME (its an elixir app) to offload that work to a more performant machine?

We too were “one of the tiny fraction” of organisations that got the email for most of our machines.

I too agree that the graphs are SUPER confusing how is this machine over?

image

Is this at 1/16th CPU thing again? As others have said it would be nice if the graphs simply showed how much CPU we had to use out of 100% not this confusing state of affairs now, im not sure how we are supposed to be reading these graphs.

I think (probably like others) we dont mind paying a bit more if we are using too much resources but please make it CLEAR how close we are getting to our limits instead of this mental gymnastics we have to do to work it out on shared machines.

If I understand it correctly then the BASELINE is the 100% mark. We must try to keep our machine under that, correct? If this is the case that this massively changes the pricing dynamics for us on fly. I have been working under the assumption that 100% CPU utilization is what we should be aiming for “for maximum usage” baseline means we are going to have to provision A LOT more machines :frowning:

Is this correct? Unfortunately we are running nodejs which makes it hard to utilize more cores. Does that mean we are getting penalized for not running a multi-threaded app?

is your nodejs app just a web server? If so, it should be pretty simple to run on multiple cores, in that case using the 1 8x-shared might be better than 8 1x-shared instance.

Its a webserver yes but it primarily communicates via web sockets. Would this be “pretty simple” to handle? would this involve running 8 copies of node at the docker level or doing something more fancy with web workers within a single node process?

Pretty much this: Cluster | Node.js v22.9.0 Documentation

I have this setup running for my next app. As for websockets, it should work too. I have my websocket stuff as its own machine.

No. We’re not asking you to change the way your app works. We’re not telling you we want you to provision bigger instances for your app. We’re not hoping you pay us more money. (I mean, we are in the long run, but this isn’t how we get there).

What we’re trying to communicate is that, over the next month or two, we are going to bring our resource scheduling in line with our longstanding documentation and pricing: a shared-1x is 1/16th of a core. Since most applications are bursty, using core time not continuously but instead sporadically in response to requests, shared instances will accrue burst credits. Ideally, and especially if you’re just running a vanilla Node.js app, nothing should change for you.

I feel like people are reading this announcement as if we are detecting people overutilizing resources and then responding by throttling back their Machines. That’s not what we’re doing. You can continue pushing as hard as you want on the cores allocated to your Fly Machines. The performance changes you will see under this new scheme, you are already seeing on the platform; you just see them nondeterministically, depending on the mix of apps that happens to be scheduled on the same hardware. That sucks. It happens because every current shared machine has unlimited burstability until it hits CPU contention. That’s what we’re fixing.

(This is as much a response to the whole thread as it is to you in particular; don’t read too much into my tone. If you’re really worried that you’re going to need to spin up lots more instances, reach out; maybe we’ll talk you down from that.)

1 Like

Is it a batch job? Is it very sensitive to execution duration? If it isn’t, it’s likely none of this will matter.

I’m running an app on two machines. I got an email yesterday saying that one of the machines would have been throttled. I looked at the provided metrics and see that while the mentioned machine does go over the baseline at peak times, the other machine doesn’t, while both are in the EU region.

First machine in AMS (above baseline):

Second machine in WAW(below baseline):

I would now assume that instead of scaling the affected machine up (as mentioned in the email), couldn’t I distribute the load more evenly across both machines via soft limits, so it stays below the baseline?

Hi there, a few questions:

– What is the cap for CPU credits? My graphs show something like 8.33 mins. How long does it take to get to the cap?

– How CPU credits are consumed? What kind of a burst these 8.33 min will cover? How do I calculate it?

– For a shared-2x or shared-4x the CPU load graph shows average or max CPU core load? I wonder what happens if only one core is abused

– I assume current email notifications are sent out manually. Will there be an automated email notification in the future to let me know that my instances are throttled/out of credits?

1 Like

I got the email as well. I have to agree with others that the communication could be more clear. I spent quite some time trying to understand what is actually being said, where I can find the information and what I should do.

Perhaps copy the text below to the beginning of your message?

Some virtual machines have been overutilizing their CPU capacity. We at Fly.io have been lax about the overutilization so far, but as other users on the same server are impacted, we are introducing CPU quotas and throttling.

The CPU quotas and throttling will be introduced in stages, allowing you to monitor the impact of throttling and quotas on your services.

You can check your CPU usage from

https://fly-metrics.net/d/fly-instance/fly-instance?from=now-1h&to=now&viewPanel=69

In that view, green line is the percentage of your CPU utilitization of the total CPU capacity of the server, not of your quota.

The yellow line is the baseline, your quota limit for the CPU use. For shared-1x servers, the baseline is at 6.5% utilization. So if your CPU load is at 6.5%, you are using 100% of your quota. The graph uses percentages of the CPU load of the server instead of your quota, because you are allowed to temporarily exceed your load.

The blue line is your quota balance in time. If you underutilize the CPU, you will gain some credits, which are then used to “pay” when you overutilize your CPU during peak loads. The balance tells you how long your balance will cover the peak load.

The balance will never go below 5ms. If your balance is constantly at 5ms, then it means very likely you have been overutilizing the CPU.

If you are overutilizing the CPU, your servers will be automatically throttled when your balance goes negative, and you may experience your servers slowing down.

To avoid this, you can increase your server capacity, for example by upgrading to performance server with the command line below or by changing your fly.toml configuration file. You cannot increase the server capacity from the dashboard. Performance server requires minimum of 2GB of memory.

fly machine update eabcee7ef01111 --vm-cpu-kind performance --vm-memory 2048

6 Likes

Current limits on balances are documented here.

Let’s take a shared-2x machine as our example. For each vCPU, the machine get’s 5ms of baseline quota per 80ms period. It can accumulate 2x 500s of balance.

Each vCPU running at 100% will consume 75ms (period - baseline) of balance. So a single core could run at 100% for 13,333 periods (1000s/75ms) which is 18 minutes. Running both vCPUs at 100% would consume 150ms of balance per period and could be sustained for 6,667 periods (1000s/150ms) which is 9 minutes.

There are several charts, some of which show per-CPU load. The ones showing combined CPU load show the average between vCPUs.

That’s TBD. Something that’s getting lost in this conversation is that there’s nothing wrong with getting throttled. Many apps will chose to run as hard as they’re allowed to and that’s a totally fine way to use the platform. We’ll be looking at ways to notify users whose machines are working at their limit without unnecessarily bothering users who are doing so intentionally.

2 Likes

Do you have any recommendations for loads that are singled thread performance bound?

I was previously unaware that “performance” meant 62% of a hyperthread, though I had noticed that inconsistently a “nice” value would slowly creep up on my CPU graphs for a 1x-performance when I saturated the available CPU on some hosts. I assume that this change will mean I’ll see that behavior 100% of the time now (with some graphing improvements too!).

Since it sounds like baseline is cumulative, even if used on a single core, does this mean I should use a 2x-performance going forward and pin my process to only one of the cores? Would this avoid scheduling issues on the core and/or hot cores that another tenant may have been allocated? (e.g. what if I pin the same core as one of my 37% tenants, do I need to be concerned about this and/or what metric would show this happening?)

If this sounds viable to you I’m happy to give these changes a shot! But I’d also appreciate considering making it easier to get a dedicated core for these types of workloads, you use CPU models with good single core IPC and I’d love to be able to fully leverage that out of the box! (And this isn’t feedback on new behavior fwiw, this behavior already existed, it was just more opaque and random).